WordPress charts can come in handy, and there are several high quality plugins you can use to create charts for your WordPress site. Recently, we needed to display multiple charts for each page on a client’s site. These were the requirements:
- Standardize chart display
- Standardize chart location on the pages
- Client should be able to update multiple data points on each page rapidly
What tools exist for creating WordPress charts?
When we start new projects, we look at the existing tools available. Often, ready-made tools fit our needs, and using existing saves us from spending time re-inventing the wheel.
- Responsive Charts is available on Code Canyon for $16.
- Beaver Charts has a free version available on the WordPress repository.
- Beaver Charts has a paid version available ($9 for an annual license or $29 for a lifetime license) on the FlickDevs website.
These solutions provide great-looking charts, but didn’t match our needs for this project.
Want to see the WordPress charts before you read on? See the magic here.
Responsive Charts makes beautiful charts and provides many options: bar graphs, pie charts, doughnut charts, line charts. However, the charts are handled in a different area of the WordPress admin area, not inside each page. This makes sense for some uses. However, for this use case, we needed to associate three or four different charts with each page, and manage each chart directly inside the page editing area.
To do this with Responsive Charts, we would have needed to include the shortcode from each responsive chart into an associated Advanced Custom Field for each type of data in each page. With school entries and charts handled independently from each other, managing the creation process and the updating process would be more complicated. Users couldn’t update the data directly on the relevant page; they would have to switch back and forth between the chart editing area and the page editing area.
If you only had a handful of charts on a site, or needed to re-use the same charts on various pages throughout the site, Responsive Charts would be a good solution.
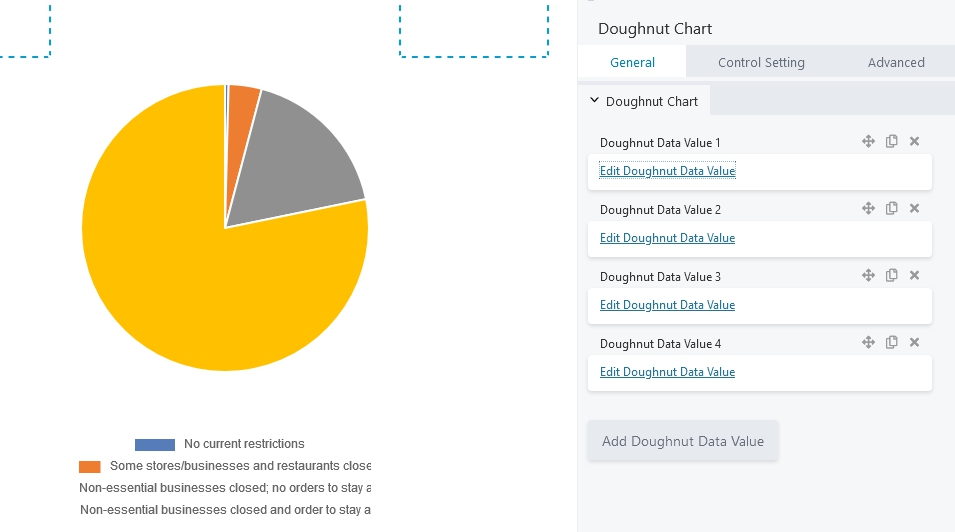
The Beaver Charts plugin, which works with the Beaver Builder page editor, has separate entries to edit for each number as you can see in the screenshot below. Clicking into each one (“Edit Doughnut Data Value”) opens up a new box where you enter the number. When you only have a chart or two, that can work out fine. But when there is a lot of data to enter, requiring a user to click to enter each number separately can quickly become cumbersome. Entering all the numbers on one page or data entry area, similar to the way you would add data in a spreadsheet or table in a word processing program, would be much quicker.
How did we add the WordPress charts?
Further research led us to Charlotte Hyland’s GitHub, where she shares a method for creating WordPress charts using ChartJS and Advanced Custom Fields. Many thanks to Charlotte for getting us pointed in the right direction. She helped us connect the dots between Advanced Custom Fields and ChartJS, so we could have good-looking charts with easier data entry in the admin area.
We’ve outlined our steps below. Or you can see these files for WordPress charts using Advanced Custom Fields Pro and ChartJS at Github.
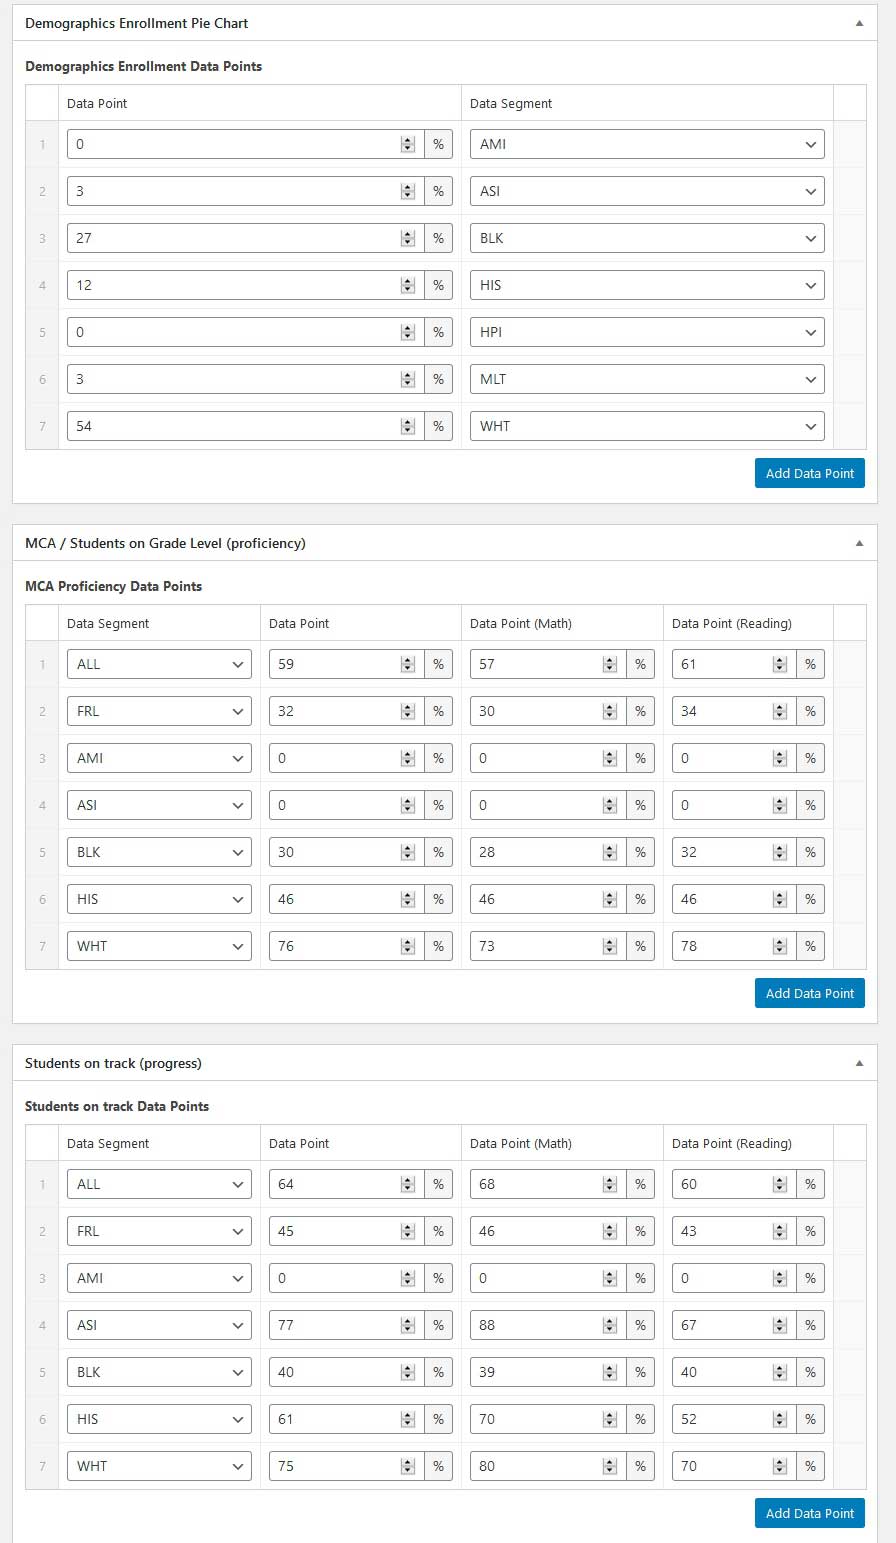
Step One: WordPress charts data entry with Advanced Custom Fields
First, using Advanced Custom Fields, we created three field groups. These groups represented the different charts required on each page:
- Demographics Enrollment Pie Chart
- Graduation Rate
- MCA Proficiency
Each field includes one repeater field:
- Data Points.
Each repeater field has a different name inside its field group so we can easily distinguish one from another when using the fields. In this case, we called them “Demographics Enrollment Data Points,” “Graduation Rate Data Points,” and “MCA Proficiency Data Points.”
The repeater field includes 2 subfields:
- Data Point
A number field, to which we appended %. This tells the user he shouldn’t enter the percent sign when he enters the data. - Data Segment
A select field, giving demographic options to choose from in a drop-down box. This standardizes the data entered.
We set these custom fields to show up on our custom post type. Now the client can enter data points directly for each post.
Step Two: Creating the charts with ChartJS
These are the files inside the theme folder that are involved in the chart set-up:
- functions.php
- inc/chart.php
- w2dc-plugin/templates/frontend/listing_single.tpl.php (this is a template file associated with the directory plugin we used, but you could add this code to any template file)
See the files for WordPress charts using Advanced Custom Fields Pro and ChartJS at Github.
functions.php
In this file, we enqueue the javascript, but only on the our custom post type pages, to prevent conflicts with other plugins (notably, a conflict on mobile with Ninja Tables).
//JS Chart scripts
function js_chart_scripts(){
  if ( strpos($_SERVER['REQUEST_URI'], 'school-profile') !== false )  { // only load on school profile pages
       wp_enqueue_script( 'chart', 'https://cdnjs.cloudflare.com/ajax/libs/Chart.js/2.7.2/Chart.js', array( 'jquery' ) );
    }
}
//Register hook to load scripts
add_action('wp_enqueue_scripts', 'js_chart_scripts');
inc/chart.php
In this file, we pull in the Advanced Custom Field data, and create the charts.
<?php
/* Helper Functions */
function get_chart_background_colors( $data_segment_array ) {
  $background_color_array = array();
  foreach( $data_segment_array as $data_segment ) {
    switch ( $data_segment ) {
      case 'ALL':
        $background_color_array[] = '#5dc5c4';
        break;
      case 'FRL':
        $background_color_array[] = '#5dc5c4';
        break;
      case 'AMI':
        $background_color_array[] = '#50bc81';
        break;
      case 'ASI':
        $background_color_array[] = '#f7e3d6';
        break;
      case 'BLK':
        $background_color_array[] = '#f9d978';
        break;
      case 'HIS':
        $background_color_array[] = '#eab28b';
        break;
      case 'WHT':
        $background_color_array[] = '#8797ae';
        break;
      case 'HPI':
        $background_color_array[] = '#dbe1f1';
        break;
      case 'MLT':
        $background_color_array[] = '#4276b1';
        break;
    }
  }
  return $background_color_array;
}

function add_quotes_to_array_items( $arr ) {
  $return_arr = array();
  foreach ( $arr as $item ) {
    $return_arr[] = '"' . $item . '"';
  }
  return $return_arr;
}

/**
* Data
*/

/* Also can be used for Grad Rate and MCA Proficiency */
function red_get_demographic_data( $data_type = 'demographics_data_points' ) {
   $data = array(
     // 'data_points_array' => array(),
     // 'data_segment_array' => array(),
     // 'background_color_array' => array()
   );
   if ( have_rows( $data_type, $post_id ) ):
     while ( have_rows( $data_type, $post_id ) ) : the_row();
       $data_points_array[] = get_sub_field('data_point');
       $data_segment_array[] = get_sub_field( 'data_segment' );
     endwhile;
       $background_color_array = get_chart_background_colors( $data_segment_array ); // Get background colors based on data segment values

       // Format Data Points
       $data_points_array = implode( ', ', $data_points_array );
       $data_points_array = rtrim( $data_points_array, ', ' );
       $data['data_points_array'] = $data_points_array;

      // Format Data Segment
       $data_segment_array = add_quotes_to_array_items( $data_segment_array );
       $data_segment_array = implode( ', ', $data_segment_array );
       $data_segment_array = rtrim( $data_segment_array, ', ' );
       $data['data_segment_array'] = $data_segment_array;

       // Format Background Color
       $background_color_array = add_quotes_to_array_items( $background_color_array );
       $background_color_array = implode( ', ', $background_color_array );
       $background_color_array = rtrim( $background_color_array, ', ' );
       $data['background_color_array'] = $background_color_array;
    endif;
    return $data;
}
/**
* Display Chart
*/
  function red_display_chart( $data = array(), $options = array(), $post_id = null ) {
    // Bail early if no data
    if ( empty( $data ) ) {
      return;
    }

   // Option defaults
    $options = wp_parse_args( $options, array(
      'type' => 'doughnut',
      'chart_label' => '', //Demographics
      'canvas_id' => 'myChart'
    ) );

    if ( $post_id === null ) {
      global $post;
      $post_id = $post->ID;
    }
    ?>

  <canvas id="<?php echo $options['canvas_id']; ?>" width="200" height="200"></canvas>
  <script>

// DATA HERE
  var ctx = document.getElementById('<?php echo $options['canvas_id']; ?>');
  var myChart = new Chart(ctx, {
      type: '<?php echo $options['type']; ?>',
      data: {
          labels: [<?php echo $data['data_segment_array']; ?>],
          datasets: [{
              label: '<?php echo $options['chart_label']; ?>',
              data: [<?php echo $data['data_points_array']; ?>],
              backgroundColor: [<?php echo $data['background_color_array']; ?>],
              borderWidth: 0
          }]
      },
      //https://www.chartjs.org/docs/latest/configuration/legend.html
      options: {
             // Boolean - Omit x-axis labels
        scales: {
          xAxes: [{
              display:false, //hide X-axis label
          }],
          yAxes: [{
              display:false, //hide Y-axis label
              gridLines: {
                  display:false, //remove Y-axis lines from chart
                  drawBorder: false //remove main y-axis line
              }
         }]
        },
        responsive: true,
        legend: {
          display: false,
        },
      }
  });
  </script>
<?php }
w2dc-plugin/templates/frontend/listing_single.tpl.php (inside the theme folder)
We used the Web 2.0 Directory plugin to create our listings, so we adding the chart inside the template using this code. This could be added to any template file in your theme.
<span>Demographics</span><br />
     <?php
     /* Displays chart.js. Code is in /inc/chart.php */
     $demographic_data = red_get_demographic_data();
     red_display_chart( $demographic_data );
     ?>

<span>Students on grade level (proficiency)</span><br />
     <?php
     /* Displays chart.js. Code is in /inc/chart.php */
     $grad_rate_data = red_get_demographic_data( 'grad_rate_data_points' );
     red_display_chart( $grad_rate_data, array( 'type' => 'horizontalBar', 'canvas_id' => 'myChart-2' ) );
     ?>
     <br /><br />
<span>Students on track (progress)</span><br />
     <?php
     /* Displays chart.js. Code is in /inc/chart.php */
     $mca_proficiency_data = red_get_demographic_data( 'mca_proficiency_data_points' );
     red_display_chart( $mca_proficiency_data, array( 'type' => 'horizontalBar', 'canvas_id' => 'myChart-3' ) );
     ?>
See the magic happen!
Once all is said and done, we end up with fancy charts like these, including tooltips for some of the data:

In the end, this system provided us with great-looking charts that were automatically configured based on the data entered. The client is able to update the charts at any time by entering new numbers without leaving the listing’s editing page, and the output is standardized.
Additional resources for using Advanced Custom Fields and ChartJS:
Did you find this helpful? Do you have questions? Let us know in the comments!


